Most stack audits are procurement exercises wearing a product-team costume. Export the invoices, tally the line items, find the seats nobody uses, cancel two things, report a saving. It works — you will genuinely find money. It also misses the part of the stack that actually slows a product team down, because that part never appears on an invoice.
How do you audit your product stack?
List every tool, then score each one on three axes: what it costs a year, what it overlaps with, and how many manual seams it creates — the exports, copy-pastes, and re-keyed status updates between it and the next tool. Cost and overlap you can pull from invoices and a whiteboard. Seams you have to watch for a week.
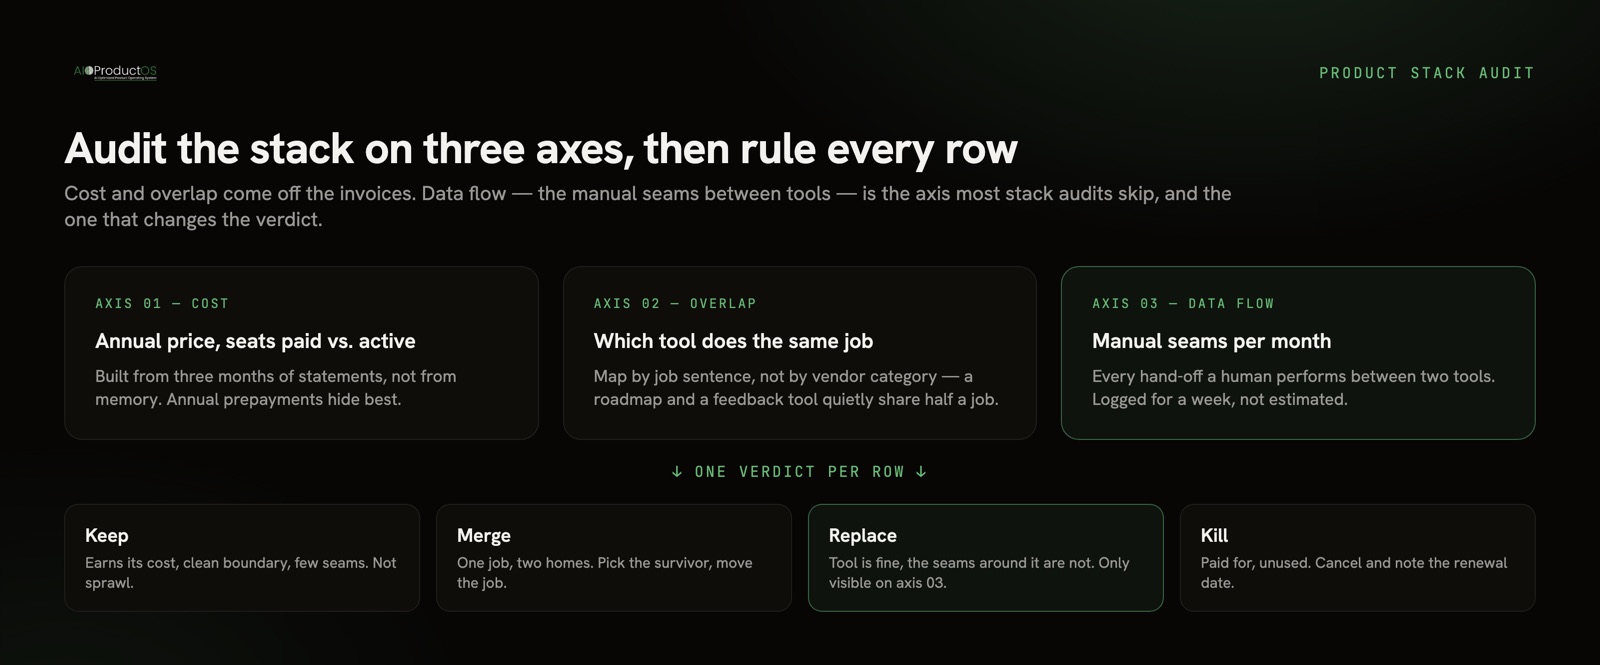
That third axis is the one page-one guides skip. They will tell you to keep two tools that are each cheap and each well-used, and never notice that a PM spends every Thursday morning moving records between them. We have written up why that gap is expensive in SaaS tool sprawl: what your stack actually costs and the full arithmetic in the real cost of a product tool stack. This post is the procedure, not the argument. If you want the money side totalled while you work through it, the SaaS stack cost calculator does the arithmetic for steps 1 and 3 in the browser.
Step 1: build the inventory from statements, not memory
Do not start with a list of tools people can name. Start with three months of card statements, the invoice inbox, and the app-store and cloud-marketplace charges, which are the ones that hide best. Annual prepayments are the classic miss: they charge once, twelve months ago, and nobody thinks of them as a subscription.
For each line, record the annual cost, the number of seats billed, and the number of people who actually signed in last month. Every tool’s admin panel will tell you the second number; you just have to open it. The gap between seats paid and seats active is where the standard audit finds its money, and it is real money — the average company runs 101 SaaS apps and wastes around $21M a year on licences nobody uses (Okta, Zylo).
If the seat count keeps drifting up faster than headcount, the pricing model is doing that, not your team — see the real cost of per-seat pricing.
Step 2: map overlap by job, not by category
Write down the job each tool does in one sentence, in your team’s words, not the vendor’s. “Where customer requests land.” “Where we decide what’s next.” “Where engineers pick up work.” “Where we check whether it worked.”
Then look for jobs with more than one tool against them. Category labels will not surface this — a roadmap tool and a feedback tool sit in different categories and quietly do half of each other’s job. Sentences surface it immediately.
Step 3: count the seams
This is the axis worth the extra day. A seam is any point where a human moves information between two tools, or where an integration exists that somebody has to maintain.
Walk one real feature end to end, from the first customer request to the post-launch verdict, and mark every hand-off. A request arrives in the feedback inbox and someone retypes it as a ticket: seam. The ticket ships and someone updates the roadmap so it stops lying: seam. Someone exports analytics and joins it to the account that asked, in a spreadsheet: seam. Then count how many times each seam happens in a month.
Ask each person to log their own hand-offs for one week rather than estimating from memory. Estimates are consistently low, because the twenty-second copy-paste does not feel like work — it feels like the job. Multiply the weekly count by four and you have a number you can put next to a licence fee and compare honestly.
The worksheet
One row per tool. Fill the first four columns from steps 1–3, then rule the last one. The rows below are illustrative — use your own figures.
| Tool | Annual cost | Seats paid / active | Overlaps with | Manual seams per month | Verdict |
|---|---|---|---|---|---|
| Feedback inbox | $4,800 | 12 / 4 | Roadmap tool | ~8 (requests retyped as tickets) | Merge |
| Roadmap tool | $6,800 | 6 / 5 | Feedback inbox, tracker | ~12 (status re-keyed both ways) | Replace |
| Session replay | $1,300 | 5 / 5 | Product analytics | ~2 (links pasted into tickets) | Keep |
| Design tool | $3,600 | 8 / 8 | — | 0 | Keep |
The four verdicts mean specific things, and the distinction matters more than the count.
Keep — earns its cost, overlaps nothing important, and creates few or no seams. A tool with deep single-discipline use and a clean boundary is not sprawl. Leave it alone.
Merge — the job is real but it is being done in two places. Pick the surviving home, move the job, and cancel the other. Merging is the cheapest verdict because there is no new vendor to learn.
Replace — the tool is fine and the seams around it are not. This is the verdict that only shows up when you count data flow, and it is the one that pays back most. A well-liked, well-used, fairly-priced tool can still be the most expensive thing in the stack if four people re-key data into and out of it every week.
Kill — paid for, not used, or used by one person for something a tool you already own does. Cancel it and note the renewal date so it does not come back.
A rule of thumb for reading the sheet: if a tool’s seam count is high and its licence cost is low, do not let the low price protect it. That is exactly the row a procurement audit approves and a product team keeps paying for. To put a currency figure on the seams and compare it against the licence column directly, run your numbers through the SaaS stack cost calculator.
When keeping the extra tool is the right call
Consolidation is not automatically correct, and the honest audit produces “keep” rows.
Specialist depth your team actually uses. If designers live in the design tool eight hours a day, a general-purpose alternative is a downgrade no matter what it saves. Depth in daily use beats a tidier logo count.
Procurement and compliance constraints. A negotiated multi-year contract, a signed DPA, or a tool that sits inside an audited control set is not a line you can cancel because a spreadsheet says so. Note the constraint on the row and revisit at renewal.
A team that would revolt. Tooling that is welded into engineering ritual — sprint ceremonies, PR automation, bot workflows — costs cultural re-adoption to replace, not just a data migration. If the team will route around the change, the change has not saved you anything.
Migration cost above the saving. A $3,000/yr tool with two weeks of migration behind it is not a $3,000 saving. Write the migration estimate on the row before you commit to the verdict, and be honest about what the move locks you into next — vendor lock-in in product tools is a cost that arrives later than the invoice does.
There is also a market-level reason to keep this discipline rather than cutting on instinct: 68% of tech leaders are consolidating vendors in 2026, and best-of-breed stacks need 280% more maintenance. The trend is real, which is precisely why it deserves a worksheet instead of a reflex.
What to do with the seams you cannot cut
Some seams survive the audit. You keep both tools for good reasons, and the hand-off between them stays. The remaining move is to stop paying for that hand-off in human time — join the tools on one record rather than syncing them by hand.
That is the design AIOProductOS starts from: revenue, feedback, work, and code write to one shared customer record, so every task carries the customer and the revenue behind it instead of pointing at another system that holds them. Over 100 live connectors feed the tools you decided to keep into that record, which means the “keep” rows on your worksheet do not have to become “replace” rows to stop costing you seams. Pricing is flat by tier rather than per-seat, so the seat column stops growing every time one more person needs to look at something.
Run the audit on your three axes first. The verdicts are more useful when you can see all three columns at once — and the seam column is the one that changes what you decide.
Put a number on your own stack. The SaaS stack cost calculator totals the licences, the integration time, and the context lost between tools, so the seam column and the cost column are in the same units. It runs in your browser, no signup.