What is a good feature adoption rate?
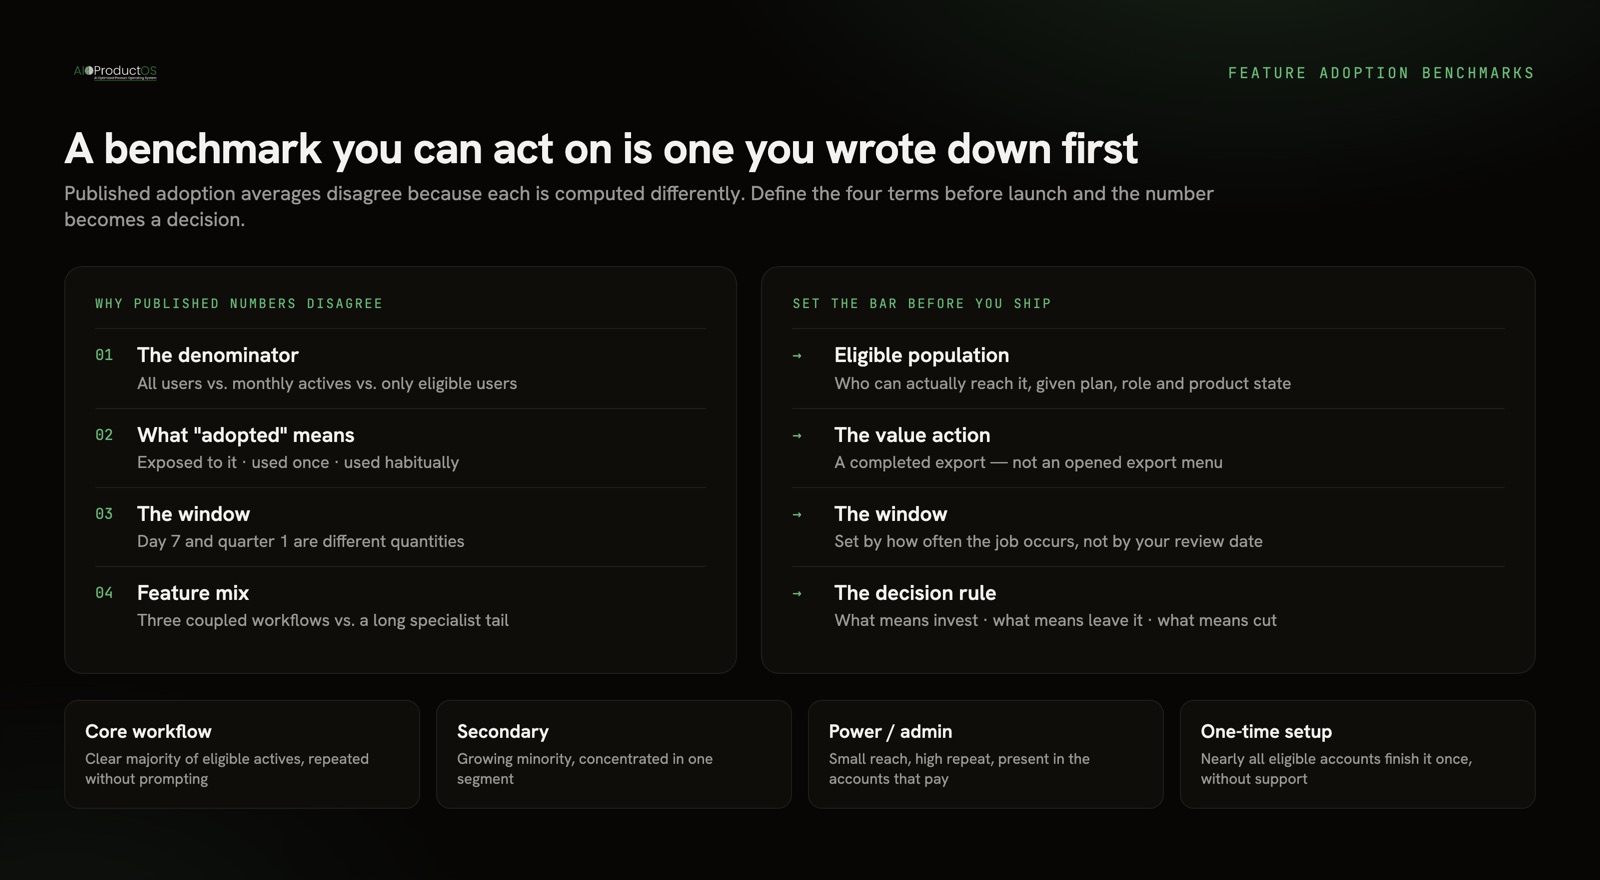
A good feature adoption rate is the one you defined before you shipped. There is no portable industry number: the published averages disagree with each other because each is computed over a different denominator, a different definition of “adopted,” and a different window. Set your bar per feature, in writing, before launch.
That answer is unsatisfying if you came here looking for a number to put on a slide. It is also the only answer that survives contact with your actual product.
Why the published benchmarks contradict each other
Search for a feature adoption benchmark and you will find several confident, mutually exclusive figures on the first page of results. One source will tell you the SaaS average sits well below what another source claims top-decile products achieve. A third will hand you a range for “core features” that is higher than both. They are not lying to you. They are answering different questions and labelling all three answers the same way.
Three choices move the number more than any real difference in product quality:
The denominator. All registered users, monthly actives, or only the users who are eligible for the feature? A permissions editor that only admins can see will post a modest rate against your whole user base and a strong one against admins. Same feature, same behaviour, two numbers that do not belong in the same table. This is the single largest source of disagreement, and it is why we treat the adoption-rate formula and its denominator traps as their own subject.
The definition of “adopted.” Some benchmarks count exposure — the user saw the feature. Some count a single use. Some count habitual use inside a window. Each definition is defensible; each produces a materially different figure from identical event data.
The window. Adoption measured seven days after launch and adoption measured a quarter later are different quantities. A published figure that does not state its window is not a benchmark, it is a screenshot.
There is a fourth factor nobody controls for: feature mix. A product whose surface is three tightly-coupled workflows will average far higher than one with a long tail of specialist tools, and neither is better run. Comparing your portfolio average to someone else’s is comparing two different portfolios.
Set the bar before you ship, not after
The fix is procedural, not analytical. The bar for a feature belongs in the spec, agreed with whoever will be in the room when the results are reviewed. Four lines is enough:
- Eligible population. Who can actually reach this, given plan, role, and product state? Name the segment, not “our users.”
- The value action. The one event that means the user got the payoff — a completed export, not an opened export menu.
- The window. Derived from how often the underlying job occurs, not from the date of your next review meeting.
- The decision rule. What result means invest further, what result means leave it, what result means cut it.
An example. You are shipping a bulk CSV import for a B2B product. Eligible population: workspace owners on accounts created before launch who have at least one existing dataset. Value action: an import that completes and writes rows, not an upload that starts. Window: two months, because importing is a migration-shaped job people do once and then rarely. Decision rule: if most eligible owners who attempt an import complete one, keep investing in format coverage; if attempts are healthy but completions are not, the problem is the flow, not the demand; if attempts themselves are thin, we misread the need.
Notice that none of those clauses is a percentage copied from a vendor blog. Every one of them is a claim about your product that a colleague can disagree with before you spend the engineering time. That argument is the point. A bar you negotiated in advance is a bar that survives the review; a bar you invent afterwards is a number chosen to justify a conclusion you already reached.
What “good” looks like, by feature class
Not every feature deserves the same shape of bar. Classifying a feature before you set its target prevents the most common review-meeting mistake: holding a specialist tool to a core-workflow standard and killing something healthy.
| Feature class | What “good” means for it | The signal that it failed |
|---|---|---|
| Core workflow — the thing the product is for | Used by the clear majority of active, eligible users, and used repeatedly without prompting | Adoption plateaus well short of the eligible base, or usage drops when you remove the onboarding nudge |
| Secondary / supporting — improves the core job | A meaningful, growing minority of eligible users, concentrated in the segment it was built for | Spread evenly and thinly across all segments — a sign nobody in particular needed it |
| Power or admin — deep or privileged capability | Small absolute reach, high repeat use, and present in most accounts that matter commercially | One-and-done use, or reach that never extends past the accounts you personally onboarded |
| One-time setup — migration, connection, configuration | Nearly all eligible accounts complete it once, quickly, without support contact | High starts and low completions, or a support queue that grows in step with launches |
The right-hand column is the useful one. For most feature classes the failure signal is more diagnostic than the level, because the level depends on definitions you chose and the signal does not.
Read the curve, not the point
A single adoption number on a single date tells you almost nothing. The shape over time tells you what to do next.
Adoption that rises and then flattens well below the eligible base is a discovery or fit problem, and the diagnosis differs sharply depending on which — the questions to ask are laid out in why nobody is using your feature. Adoption that rises and then decays is worse news than adoption that never rose: people found it, tried it, and chose to stop. Adoption that only moves while a prompt is on screen is measuring your interruption rather than the feature’s pull.
This is also why adoption should never be the only number in the review. It belongs next to the outcome the feature was built to move, alongside the handful of product metrics that actually matter. A feature can clear any bar you set and still fail if retention, expansion, or task completion did not move for the people who adopted it.
When an industry benchmark IS worth using
Refusing all external numbers is its own kind of sloppiness. Three cases where reaching for a published figure is the right call:
Sanity-checking a wildly off result. If your number lands far outside every published range, in either direction, the most likely explanation is a measurement error — a broken event, a wrong denominator, a double-counted user. External figures are a poor target and a decent smoke alarm.
Board and investor conversations. Sophisticated readers already have a rough distribution in their heads. Naming the external range, stating your own definition explicitly, and showing where you sit is more credible than presenting a bare internal number with no context. State the definition, always — that is what makes the comparison honest rather than decorative.
Category norms for public-facing pages. If you publish adoption claims on a pricing or comparison page, buyers read them against whatever they have seen elsewhere. Knowing the norms tells you what will read as plausible, which is a communication decision, not a measurement one.
What none of these cases justify is using an external average as the pass mark for your own feature. The number that decides whether a feature earned its place has to be grounded in your eligible population and your job-to-be-done. Vendor tooling differs in how well it supports that per-feature framing — our roundup of the best product analytics tools covers which ones let you define eligibility and cohorts cleanly rather than forcing a single global denominator.
The benchmark you can act on is your own
The published benchmarks are not useless. They are just answers to questions you did not ask, computed on populations you do not have. Treat them as context and never as a target.
Everything that makes a bar defensible — who was eligible, what counted, how long you waited, what you would do about it — is a decision you make before the feature ships, when you can still be talked out of it. Make those four decisions and the review takes ten minutes. Skip them and you will spend the meeting arguing about the metric instead of the feature.
Want adoption to arrive already attached to the account and the revenue behind it? See how AIOProductOS analytics puts feature usage on the same customer record as revenue and feedback, so every shipped feature carries its verdict — adoption, MRR adopted, retention lift — on its task card.